

DATA. INSIGHTS. IMPACT.
Transform Data Into Decisions With Power BI
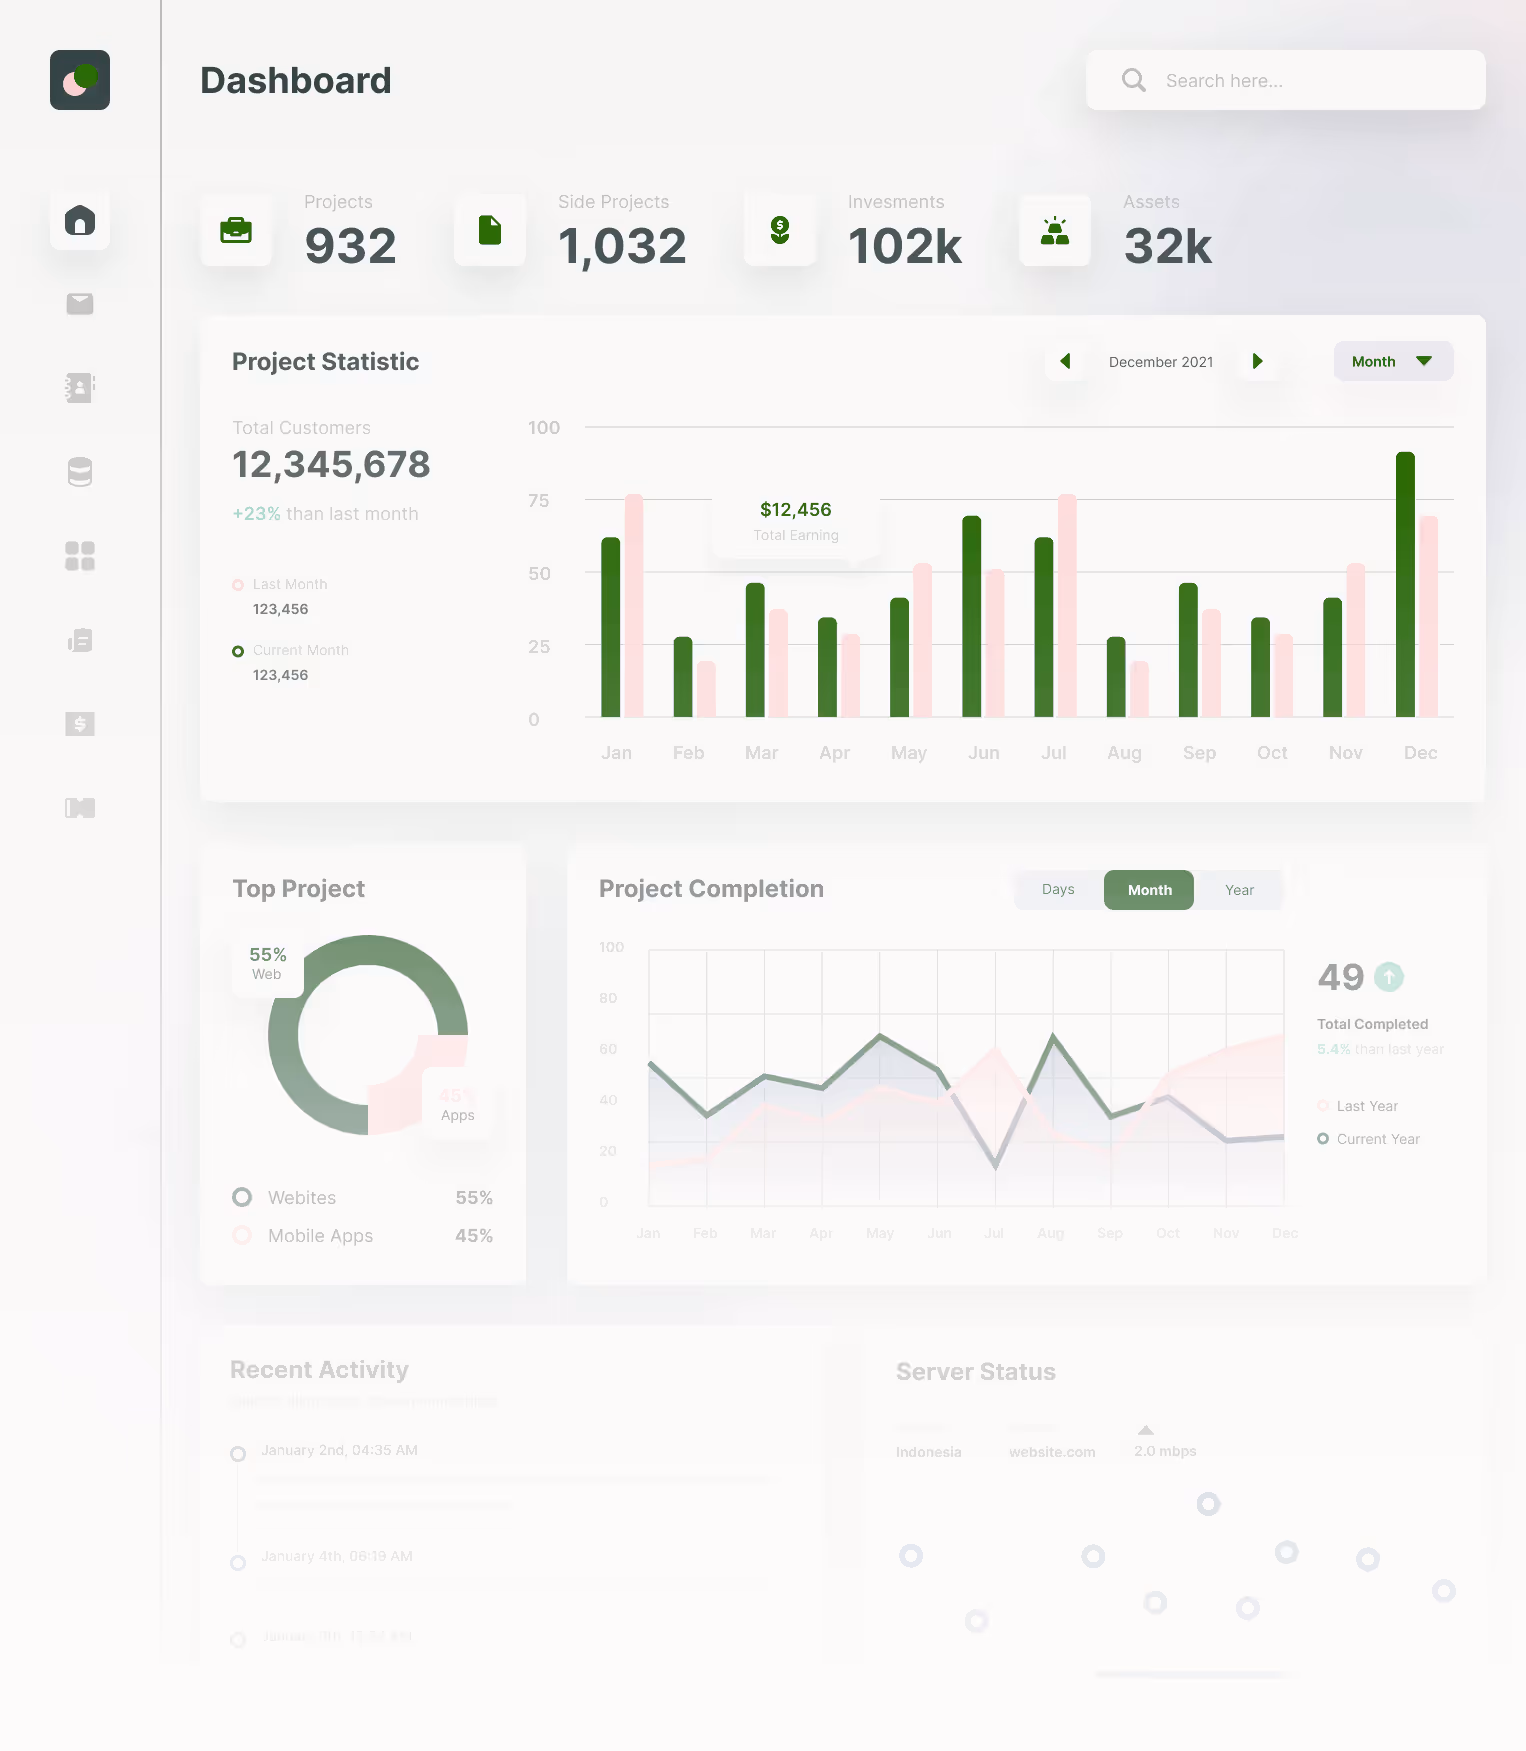
Aureus helps organisations move beyond static reports, delivering interactive dashboards, predictive insights and visual clarity that empower leaders and align teams.
Trusted by Industry Leaders Across The Globe


WHY AUREUS?
Here's What Sets Aureus Apart.
Proven ROI and Benefits
From hidden revenue to reduced overhead, our low-code solutions drive measurable ROI. We’re trusted by enterprises to deliver impact, fast.
Scales With Your Growth
Aureus builds Power BI solutions that evolve with your business, delivering real time insights, predictive analytics and secure, future ready scalability.
Microsoft Power Platform Partner
Certified experts in Power Apps, Power Automate, and Azure AD deliver enterprise-grade security and compliance.
AI-Driven Innovation Edge
Aureus harnesses Azure AI Foundry with GenAI models to modernise operations, unlock opportunities, and drive faster decisions for scalable, lasting advantage.
Partnership-First Delivery
We co-create roadmaps, embed citizen developers, and track live KPIs to guarantee measurable outcomes.
Continuous Support and CoE
24x7 monitoring, performance tuning, and a managed Center of Excellence keep every workflow at peak efficiency.
Unified Data, No Silos
Aureus uses Power BI to consolidate data into real time, interactive dashboards, cutting reporting time and enabling smarter, faster insights across the enterprise.
Proven Technical Excellence
Our Microsoft-certified team is led by a 2× FastTrack Solution Architect. We build scalable, compliant solutions with enterprise-grade precision.
Industry-Spanning Expertise
Our diverse team brings experience from sectors like finance, legal and maritime, enabling us to craft solutions that solve real operational challenges across industries.
£
1
bn+
uncovered in additional revenue
25
%
overall profit growth realised
30
%
increase in our clients' team performances
£
500
k
saved annually through enhanced operational efficiencies
WHY CHOOSE POWER BI
Faster, Smarter and More Adaptive Than Traditional BI Tools
Legacy BI systems rely on rigid data models and slow refresh cycles. Power BI offers real-time analytics, self-service visualisations and intuitive insights, enabling your organisation to pivot faster and improve continuously.
Speed
Cost
Flexibility
Integration
Automation/AI
Security & Governance
Scalablity
Maintenance
Control
ROI
Why We Build with Power BI
How We Use Power BI to Deliver Business Impact
As Power BI experts, We build Power BI dashboards with a purpose. Helping your teams uncover what matters, act faster, and align around the metrics that drive performance.
Designed to Drive Decisions, Not Just Reports
We build role-specific dashboards that spotlight the KPIs that actually move the needle, not just charts for the sake of visuals.
Built Around Your Business Questions
Instead of sifting through noisy data, we start with your real questions, then shape dashboards to deliver clear answers.
Connected to Every System That Matters
We integrate Power BI with all your key systems, so data updates live. No more downloads, silos, or sync delays.
Delivered Fast and Built to Scale
Dashboards go live in days, with enterprise-grade structure, naming standards, security, and scalable data models baked in.
Embedded Where Your Teams Work
We embed insights directly into Teams, SharePoint, and internal apps, so users don’t have to go hunting for them.
Insights That Lead to Action
We integrate Power BI with Power Automate to trigger tasks, alerts, or approvals the moment something changes.
Power BI
what problems we solve
The Bottlenecks Behind the Dashboards
Tap a challenge below to see how our Power BI solutions fix it.
With dashboards that answer the right questions at the right time.

Manual data entry, prone to human error.

Real-time dashboards, no spreadsheets
We connect Power BI directly to your sources so your data is always accurate and up to date.

Reports don’t match across teams
Unified view, aligned metrics
We build shared dashboards that give every department the same, up-to-date insights.

Timing makes insights useless
Live dashboards, always visible
We embed Power BI into Teams, SharePoint, or apps so insights are front and centre.

Insights fail to trigger action
Dashboards that trigger workflows
We use Power Automate with Power BI to turn changes in data into real tasks or alerts.
TYPES OF dashboards WE BUILD
How Aureus Transforms
Finance
Human Resources
Logistics/Ops
Healthcare
Government
Legal & Compliance

Live Budget vs Spend Dashboards
- Sync real-time spend data from Excel, ERP, or Dataverse
- Auto-alert teams when budgets near thresholds
- Filter by department, project, or cost category
Accounts Payable Analytics
- Track invoice volumes and approval delays
- Identify vendor SLA gaps and processing slowdowns
- Improve working capital decisions with trend insights
Financial Consolidation Views
- Merge data from SAP, QuickBooks, and Dynamics
- View monthly summaries, period comparisons, and variances
- Centralise P&Ls for a single version of financial truth
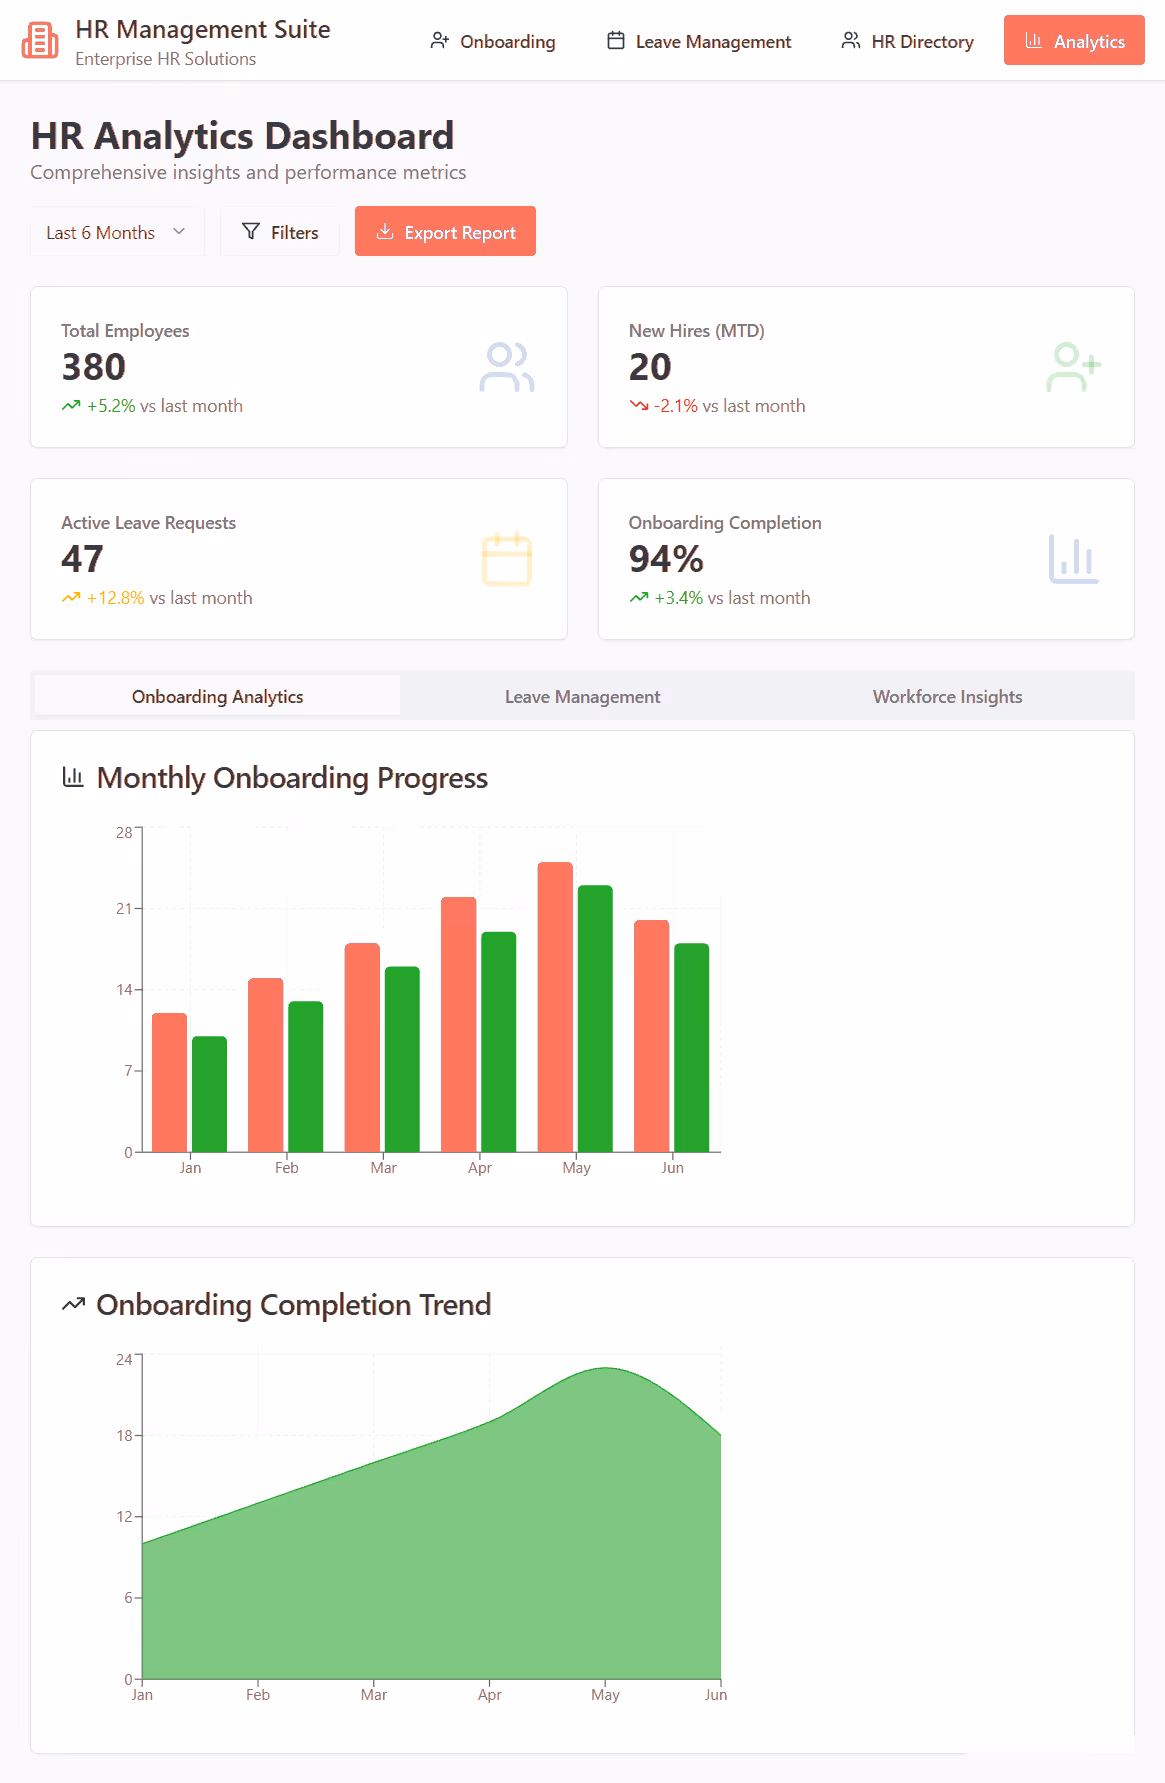
How Aureus Transforms
Human Resources
Workforce Headcount & Attrition Dashboards
- View staff churn rates and average tenure
- Analyse trends across departments or job levels
- Visualise DEI metrics for inclusion tracking
Leave & Attendance Analytics
- Spot leave balance issues and absence patterns
- Detect hotspots for absenteeism or overlap
- Allocate shifts more effectively across teams
Training & Policy Completion Tracking
- Highlight overdue staff and incomplete modules
- Monitor policy acknowledgements in real-time
- Pull data from SharePoint logs or Microsoft Forms
How Aureus Transforms
Logistics/Ops
Inventory & Stock Movement Dashboards
- Track stock turnover and idle inventory live
- Auto-trigger reorder tasks by location or threshold
- Improve procurement with SKU and location filters
Delivery Performance Reports
- Monitor on-time delivery by driver or region
- Analyse customer feedback linked to deliveries
- Strengthen proof-of-delivery compliance and alerts
Maintenance & Compliance Dashboards
- Surface missed SLAs and overdue inspections
- Track technician performance and task status
- Provide audit-ready views of pass/fail rates
How Aureus Transforms
Healthcare
Patient Flow & Wait Time Dashboards
- Map patient bottlenecks during peak hours
- Track check-ins, walkouts, and no-show trends
- Shorten wait times and balance daily load
Staff Roster & Utilisation Insights
- Match availability to patient demand by shift
- Detect underutilisation or coverage gaps
- Reduce staff burnout with balanced scheduling
Inventory & Expiry Monitoring
- Get notified for near-expiry or low supplies
- Track usage trends across departments
- Ensure safe handling of sensitive stock
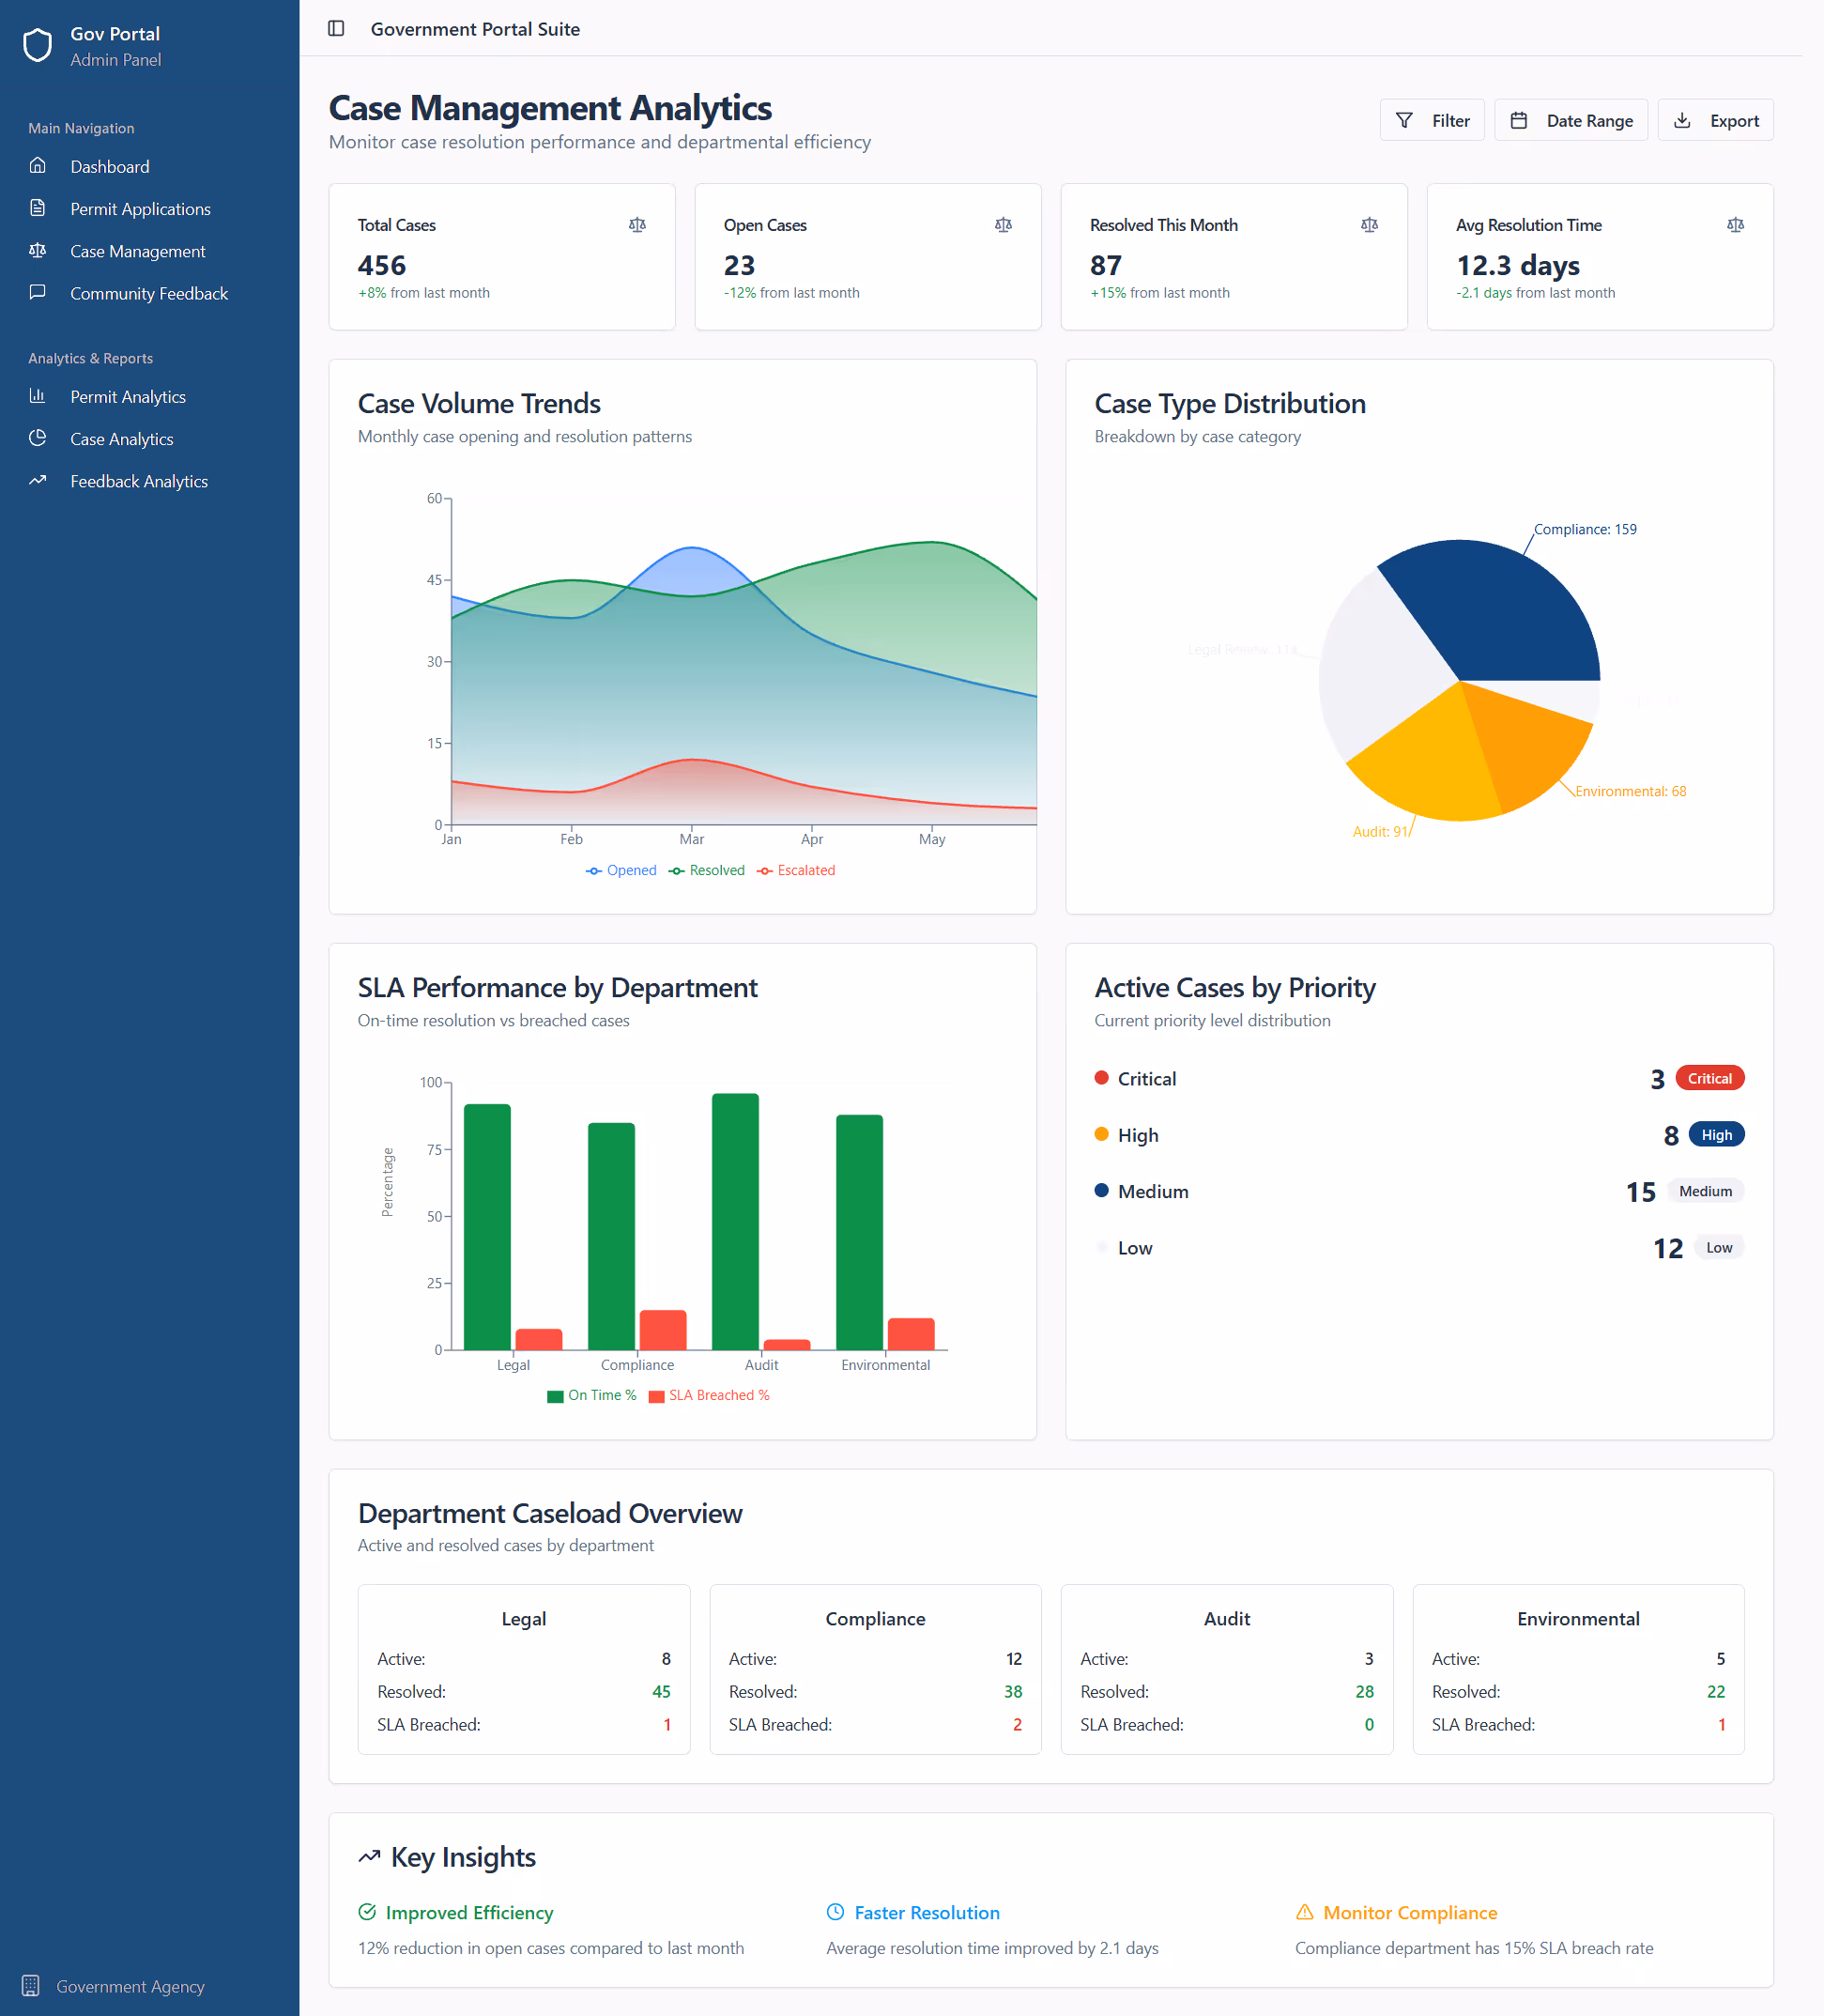
How Aureus Transforms
Government
Citizen Request & Case Volume Dashboards
- Visualise SLAs and overdue service requests
- Map backlog clusters across geographic areas
- Improve accountability across departments
Public Feedback & Survey Analysis
- Analyse sentiment by category or location
- Sync responses from Forms, QR, or websites
- Use visuals to support engagement planning
Budget Allocation & Spend Tracking
- Compare planned vs actual across departments
- Track fiscal progress by project or time period
- Improve public sector transparency and control
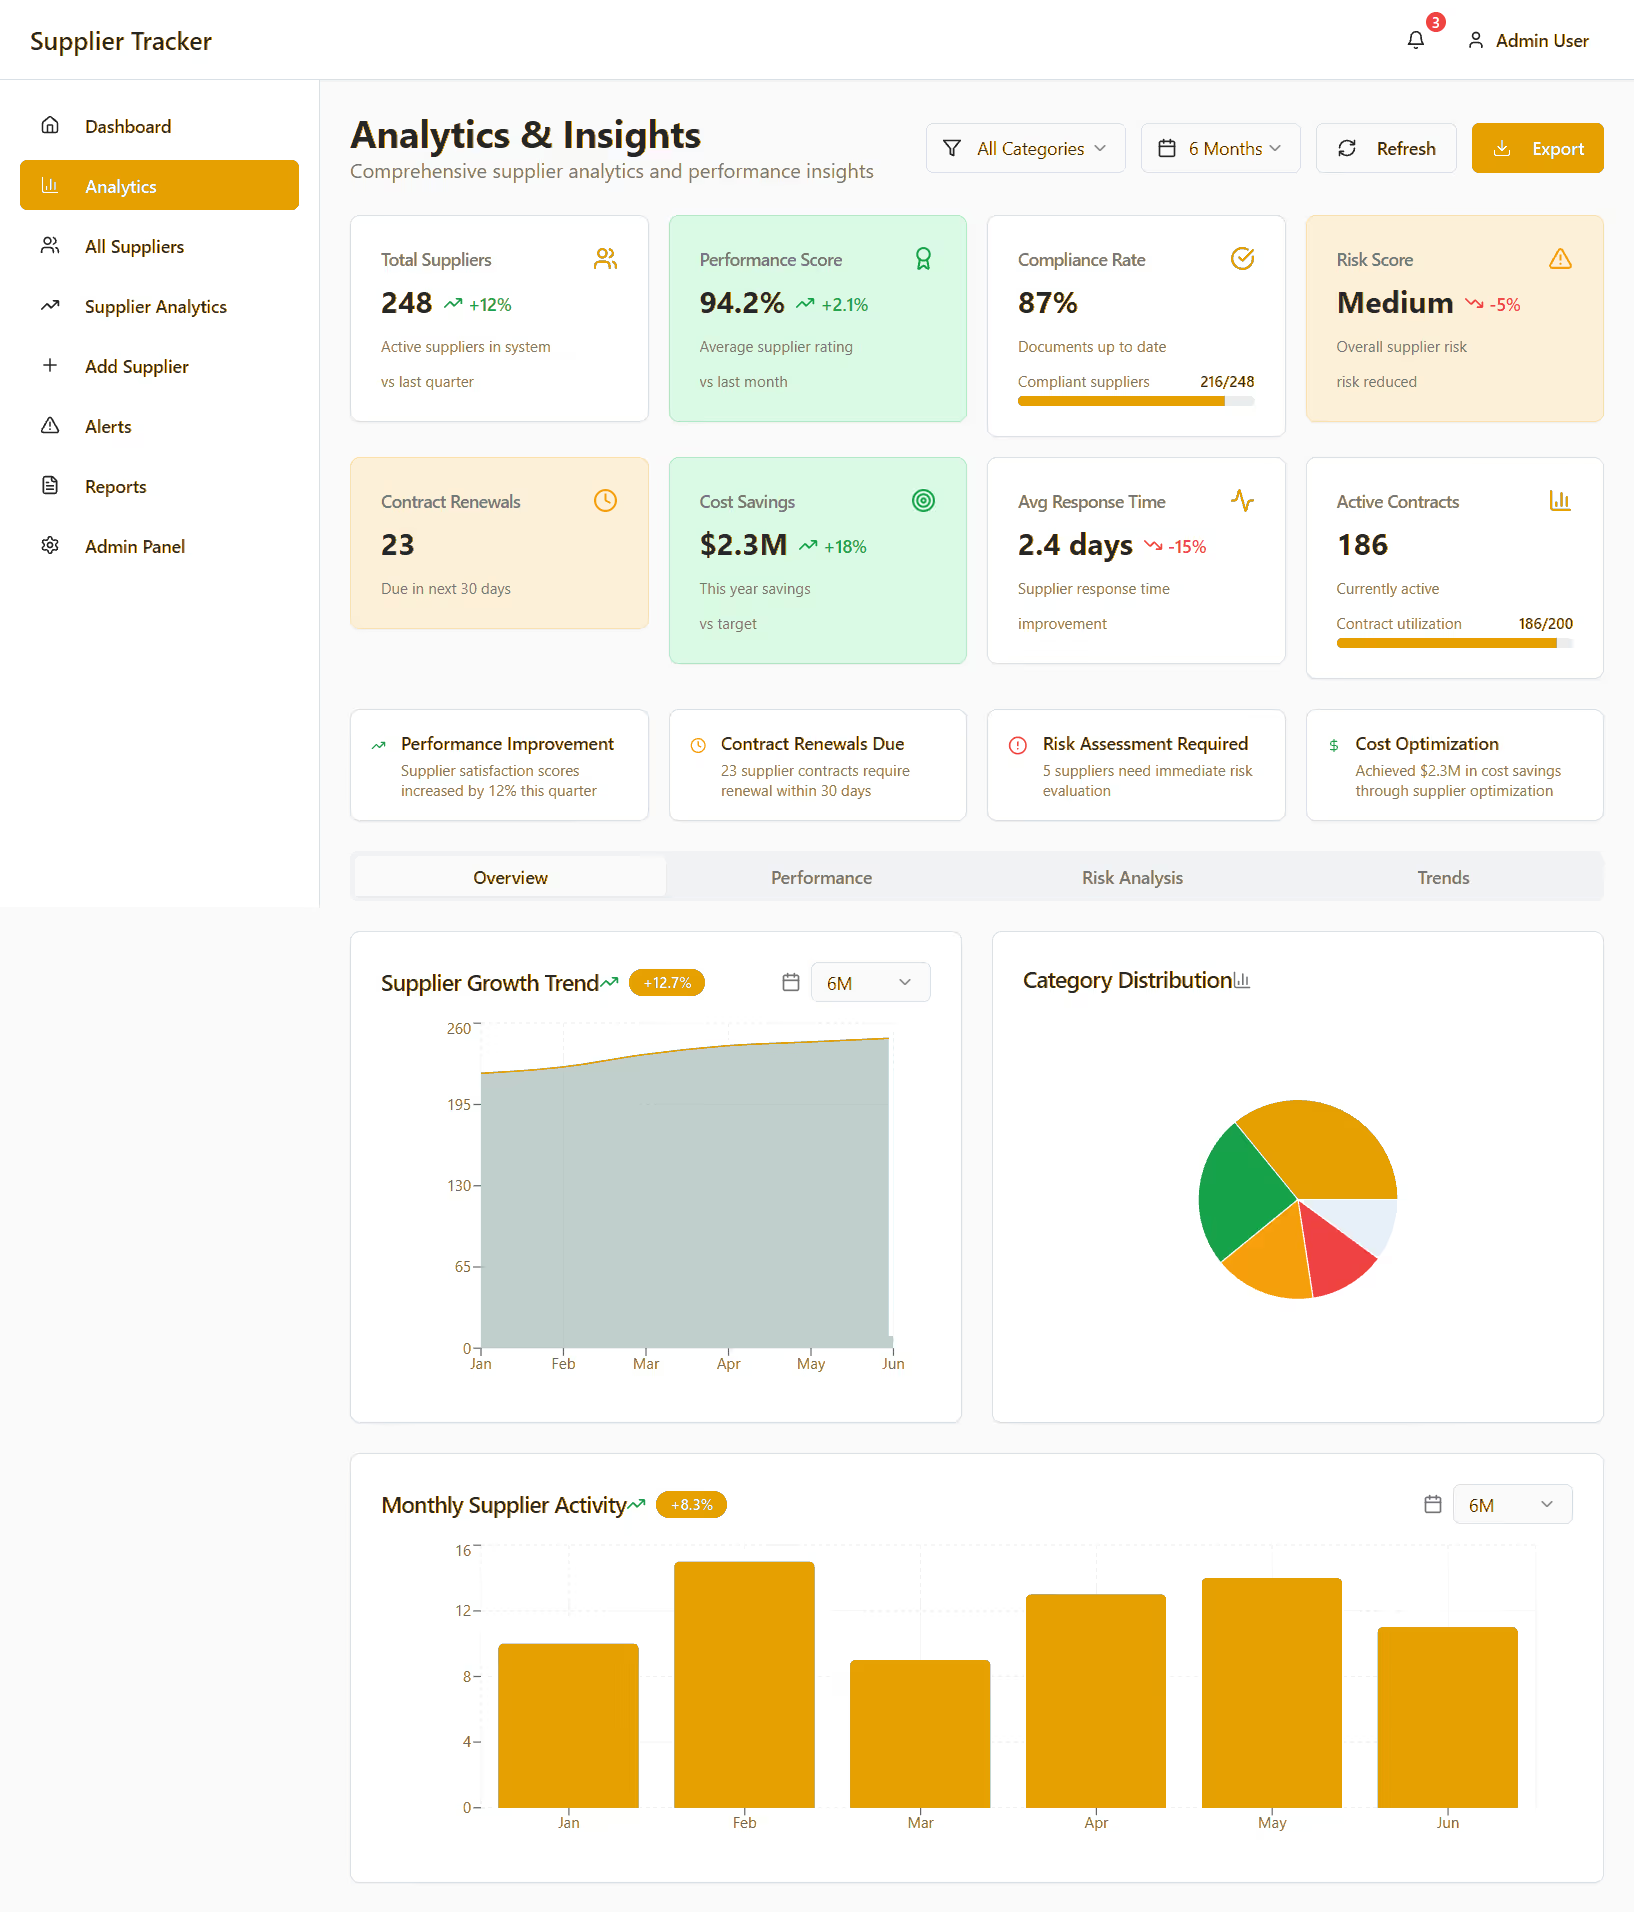
How Aureus Transforms
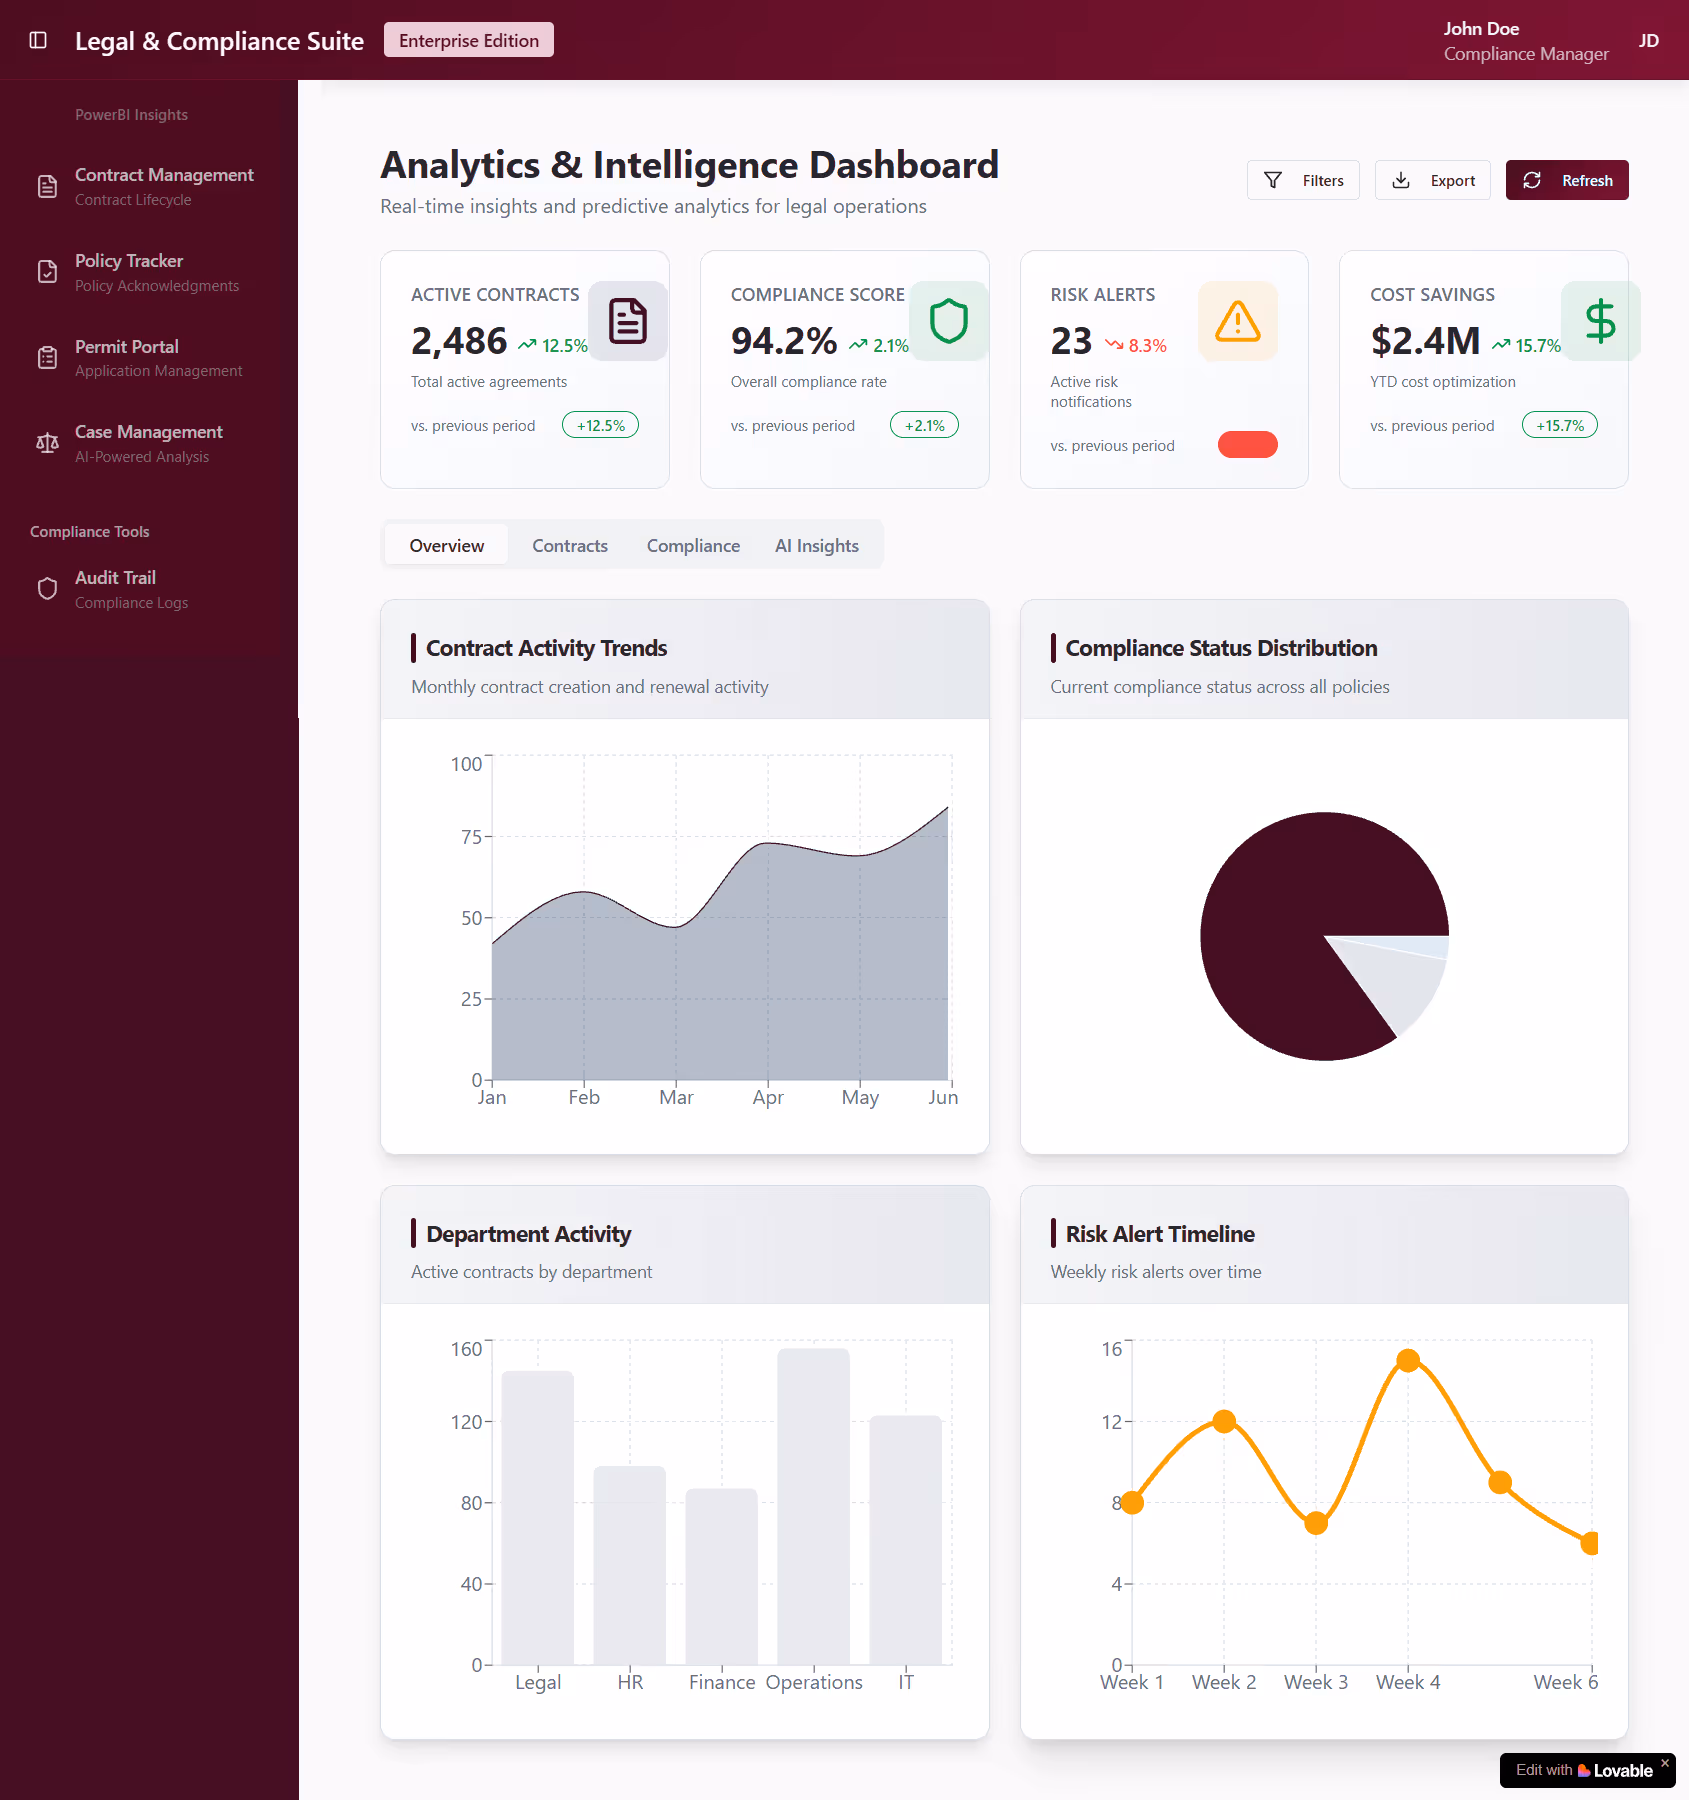
Legal & Compliance
Contract Risk & Renewal Dashboards
- Visualise contracts by expiry and risk level
- Trigger renewal alerts for legal and ops teams
- Centralise ownership and reduce lapses
Audit & Inspection Reporting
- Track checklist status in real time
- Identify issues and follow-up progress
- Strengthen compliance posture through trends
Policy Tracking & Acknowledgement Analytics
- Highlight staff who haven’t acknowledged policies
- Sync data from SharePoint or Power Automate
- Provide real-time proof of policy compliance
CASE STUDIES
Results That Speak For Us
.avif)
400K+ File Updates Auto-Tracked Daily
Trylon needed visibility into file changes across massive SharePoint libraries. Aureus built a Graph API-powered automation that tracks 400K+ daily updates in real time, surfacing folder changes instantly.


60% Faster Approvals
NHS automated invoice approvals using Aureus-built Power Apps and Power Automate workflows. Delivered in 8 weeks, with a full audit trail for compliance.


£1 Billion in Missed Revenue Recovered
E.ON Next struggled with fragmented data, making it hard to track unpaid bills. Aureus built a centralised reporting system with automation to highlight revenue gaps. Within the first phase, £4M was recovered — scaling to £1B uncovered in a year.


40% Reduction in Overdue Training & 30% Higher Pass Rates
Marks Home Care partnered with Aureus to modernise compliance training. We built a cloud-based system that automates notifications, centralises learning resources, and delivers online tests. The result: overdue courses dropped by 40%, pass rates increased 30%, and employees now complete training 20% faster — boosting compliance efficiency across their global workforce.
.avif)
Reinventing Legal Services with Cloud Automation & Security
United Solicitors wanted to modernise outdated legal operations. Aureus delivered a cloud-based client management system with automation, API integrations, and enterprise security. The result: streamlined processes, stronger client service, and rapid growth that attracted top consultant lawyers worldwide.

30% Team Performance Lift & 25% Profit Growth in Homecare
SwiftShift partnered with Aureus to tackle nurse burnout and inefficiency. We built an automated reporting and profit forecasting system that distributes surplus revenue as bonuses, while predicting future team profits. The outcome: happier nurses, reduced burnout, and measurable performance gains — with 30% stronger team output and 25% higher profits.
.avif)
£500k Annual Savings
A global enterprise used Aureus to digitise vendor lifecycle management. Power Apps + Dataverse centralised supplier data and triggered renewal reminders, saving over half a million pounds annually.